
48T
$299.00
96T
$399.00


Species:
Rat
Alternative Name:
a-CTXI, aCTX-I, A-Cr, Type I Collagen C-Telopeptide-Related Fraction
Assay Type:
Competitive
unit:
pg/mL
Standard:
6000pg/mL
Sensitivity:
56.25 pg/mL
Detection Range:
93.75-6000pg/mL
Assay Time:
1.5H
Sample Type:
Serum, Plasma, Tissue homogenate and Other biological samples;Sample Volume=50μL
Research:
Immune molecule;
Test Principle:
This ELISA kit uses the Competitive-ELISA principle. The micro ELISA plate provided in this kit has been pre-coated with Rat α-CTx. During the reaction, Rat α-CTx in the sample or standard competes with a fixed amount of Rat α-CTx on the solid phase supporter for sites on the Biotinylated Detection Ab specific to Rat α-CTx. Excess conjugate and unbound sample or standard are washed away, and Avidin-Horseradish Peroxidase (HRP) conjugate are added to each micro plate well and incubated. Then a TMB substrate solution is added to each well. The enzyme-substrate reaction is terminated by the addition of stop solution and the color turns from blue to yellow. The optical density (OD) is measured spectrophotometrically at a wavelength of 450 nm ± 2 nm. The concentration of Rat α-CTx in tested samples can be calculated by comparing the OD of the samples to the standard curve.
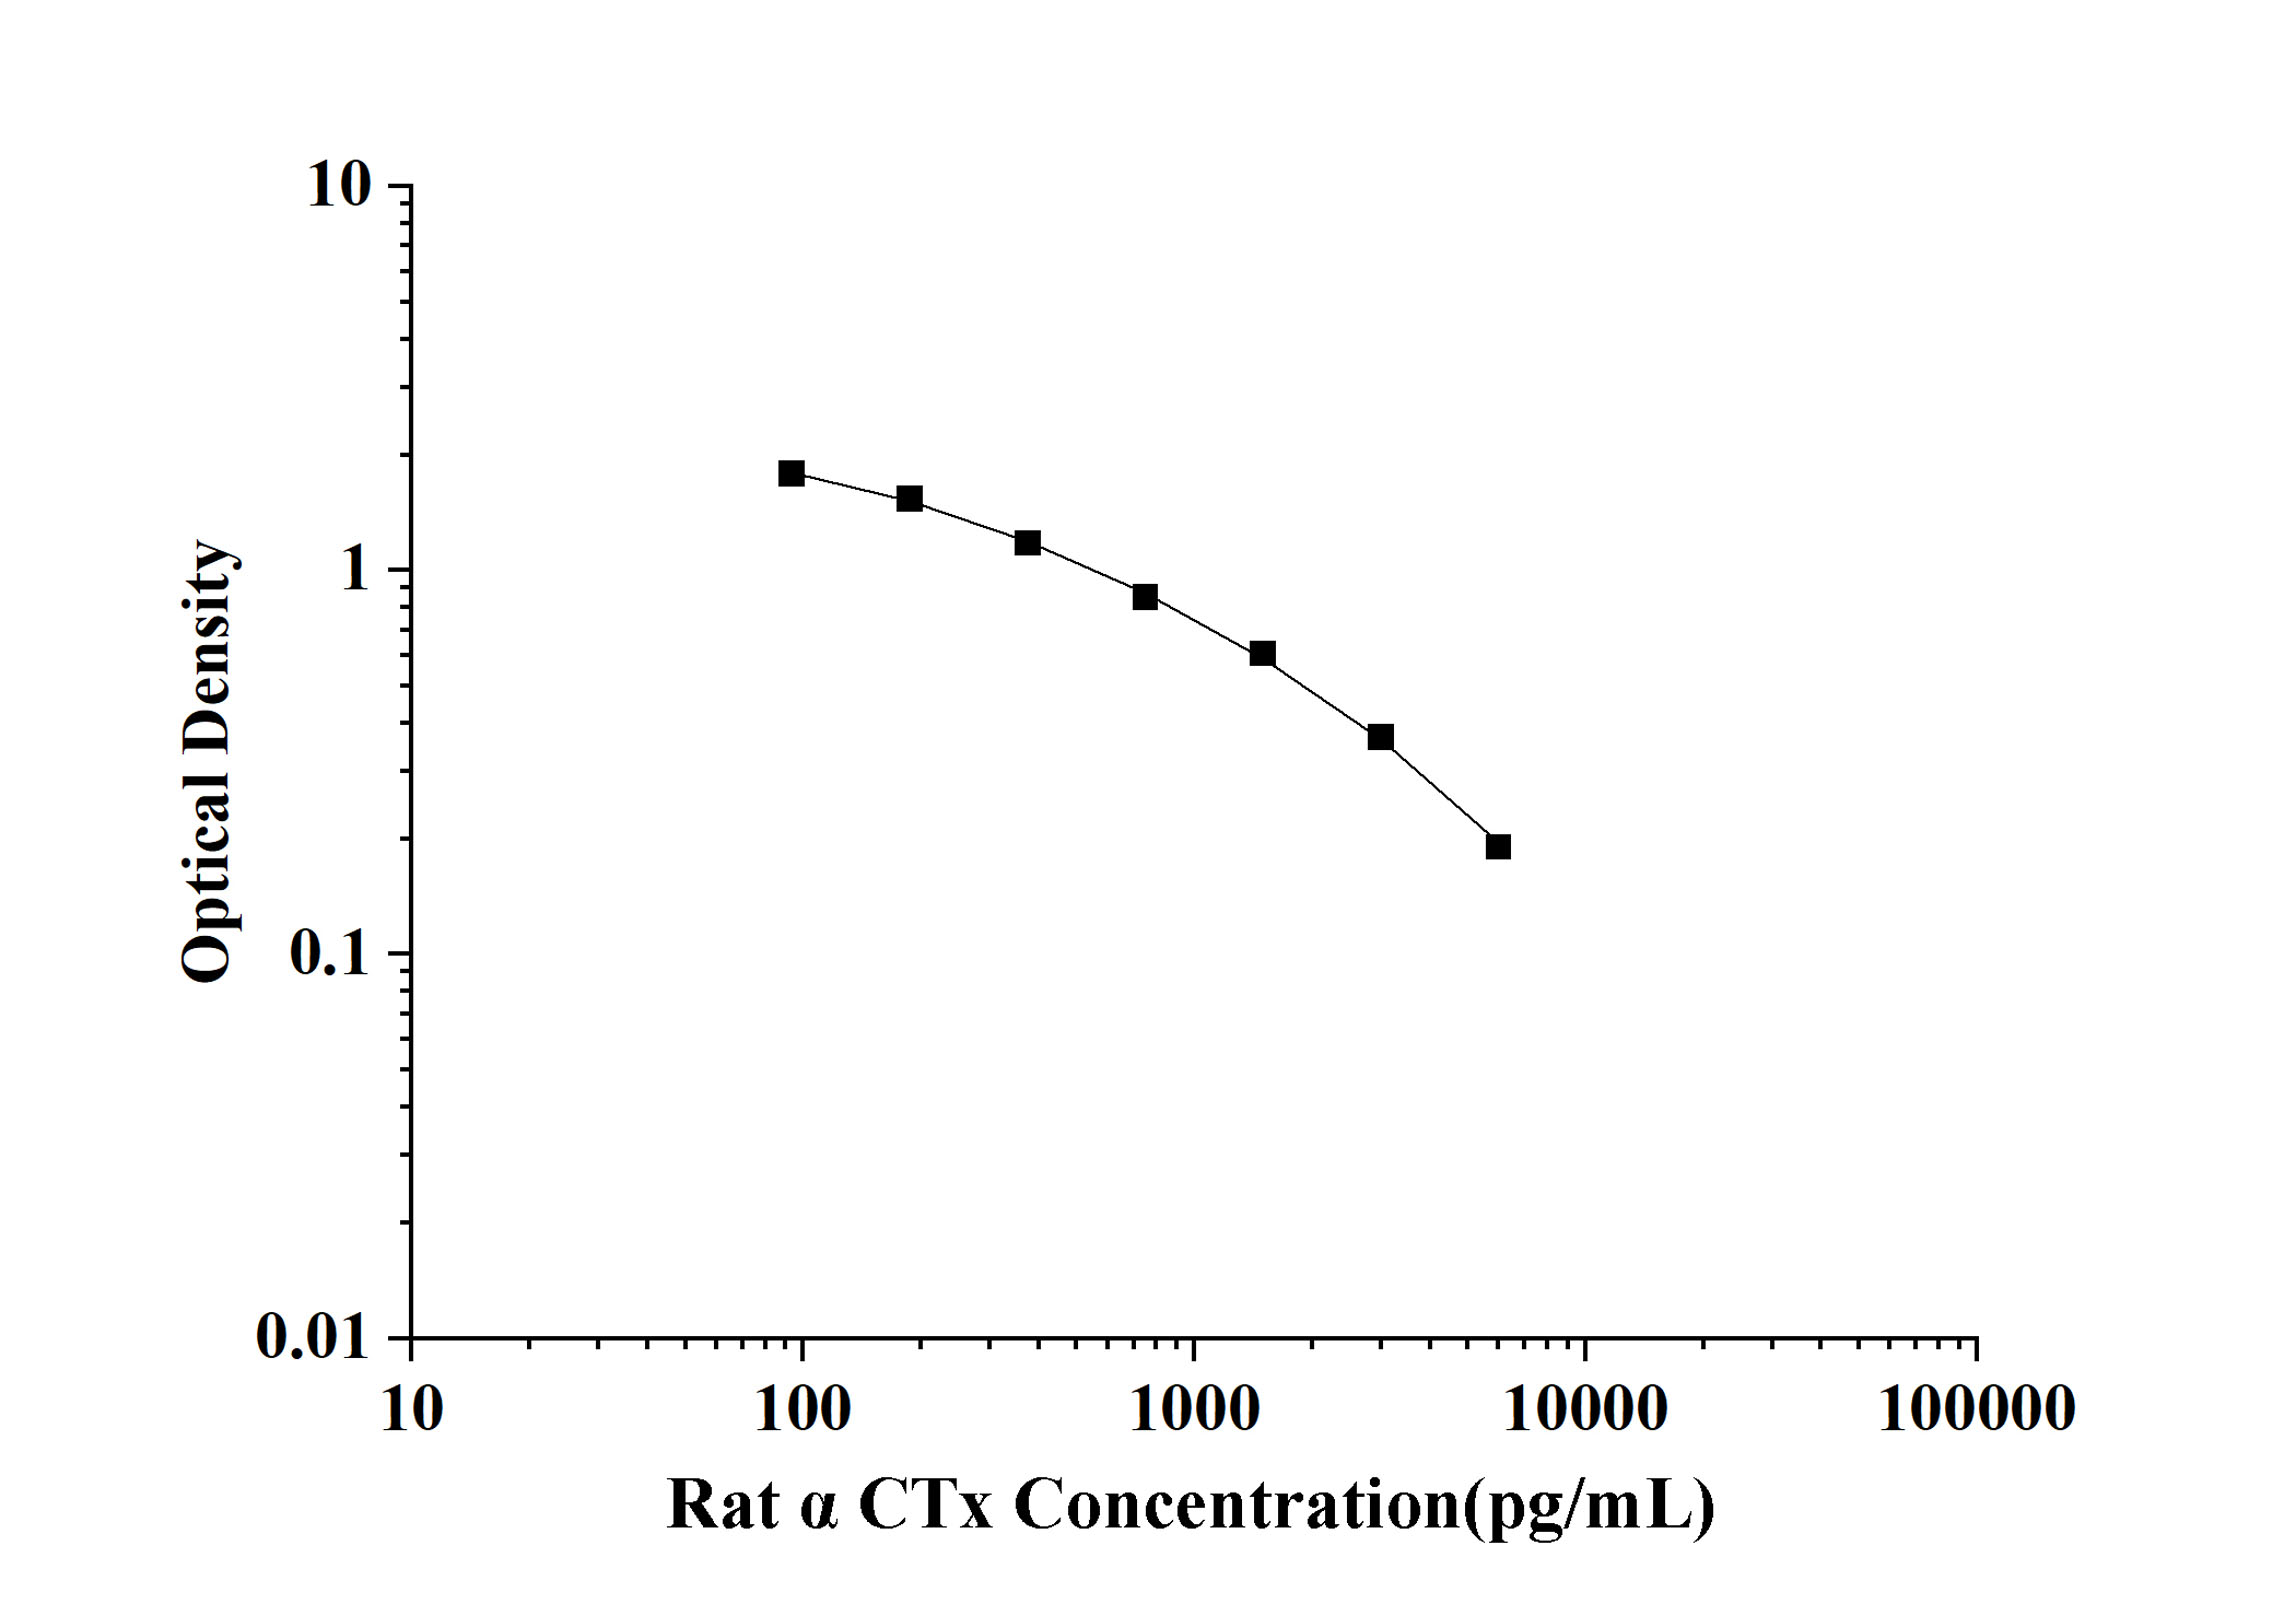
| pg/mL | OD | Corrected |
|---|---|---|
| 6000 | 0.18 | |
| 3000 | 0.358 | |
| 1500 | 0.597 | |
| 750 | 0.842 | |
| 375 | 1.167 | |
| 187.5 | 1.526 | |
| 93.75 | 1.771 | |
| 0 | 2.531 |
Intra-assay Precision (Precision within an assay): 3 samples with low, mid range and high level were tested 20 times on one plate, respectively.
Inter-assay Precision (Precision between assays): 3 samples with low, mid range and high level were tested on 3 different plates, 20 replicates in each plate, respectively.
| Intra-assay Precision | Inter-assay Precision | |||||
|---|---|---|---|---|---|---|
| Sample | 1 | 2 | 3 | 1 | 2 | 3 |
| n | 20 | 20 | 20 | 20 | 20 | 20 |
| Mean(ng/mL) | 88.95 | 1466.14 | 2333.91 | 79.06 | 1319.11 | 2250.97 |
| Standard deviation | 1.53 | 51.43 | 131.91 | 19.88 | 42.05 | 101.78 |
| C V (%) | 3.62 | 5.43 | 3.63 | 5.63 | 4.05 | 5.74 |
| Sample Type | Range(%) | Average Recovery(%) |
|---|---|---|
| Serum (n=8) | 80-92 | 86 |
| EDTA plasma (n=8) | 80-95 | 86 |
| Cell culture media (n=8) | 80-96 | 88 |
| Serum (n=5) | EDTA plasma (n=5) | Cell culture media (n=5) | ||
|---|---|---|---|---|
| 1:2 | Range (%) | 85-92 | 88-101 | 87-96 |
| Average (%) | 90 | 92 | 89 | |
| 1:4 | Range (%) | 89-96 | 85-93 | 92-105 |
| Average (%) | 91 | 86 | 97 | |
| 1:8 | Range (%) | 80-98 | 89-97 | 89-102 |
| Average (%) | 85 | 93 | 92 | |
| 1:16 | Range (%) | 81-92 | 85-94 | 92-101 |
| Average (%) | 85 | 90 | 94 |


